What is a Digital Elevation Model (DEM)? Everything you need to know about.
What is a Digital Elevation Model (DEM)? Everything you need to know about.
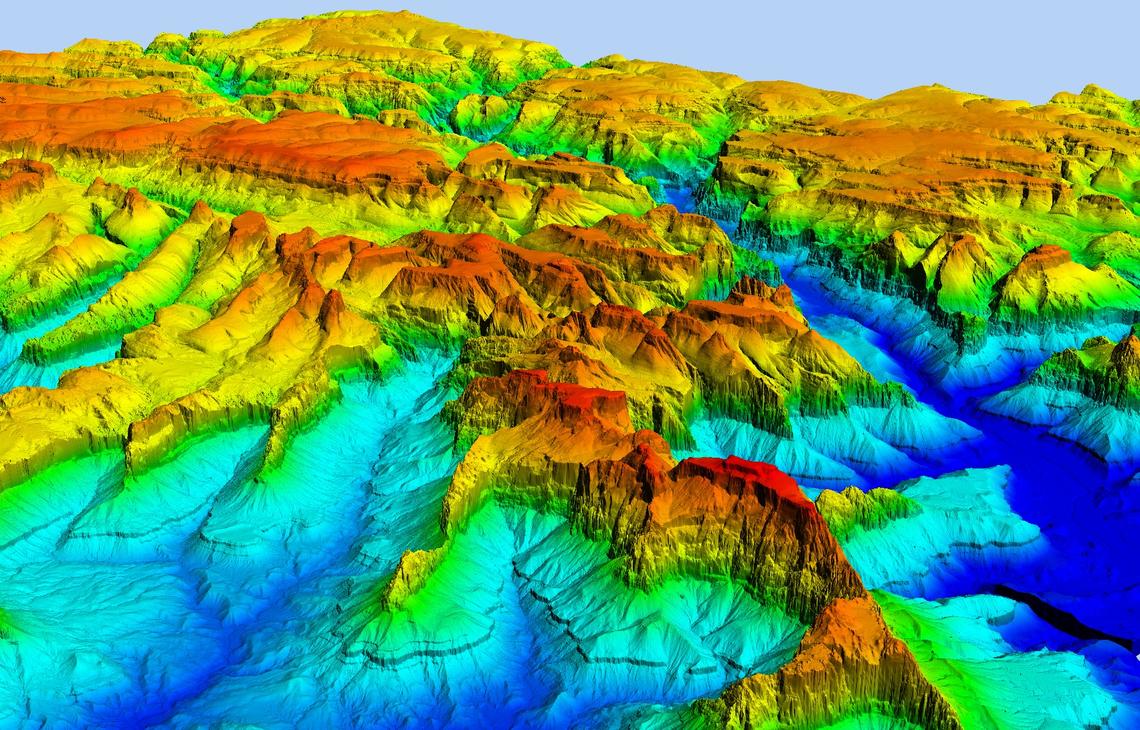
A Digital Elevation Model (DEM) is a representation of the bare ground topographic surface of the Earth. excluding trees, buildings, and other surface objects. It is a 3D computer graphics representation of elevated data to represent terrain. DEMs are often used in geographic information systems and are the basis for digitally-produced relief maps.
DEMs are created from high-resolution satellite imagery using digital photogrammetry technology. These are useful frameworks on which networks for sewerage and drainage, solid waste movement, roads, telecommunication, optical fiber, etc. can be mapped. DEM can be used for transportation as well as infrastructure planning.
A rectangular digital elevation model grid can be created by interpolating known elevation data from ground surveys and photogrammetric data capture.
How DEM can be represented?
A DEM can be represented as:
- a raster (grid of squares, also known as a height map when representing elevation) or
- a vector-based Triangular Irregular Network (TIN)
Raster data represents data in a grid matrix while vector data represents data in points, lines, and polygons.
The TIN DEM is also referred to as a primary or measured DEM, whereas the Raster DEM is referred to as a secondary or computed DEM.
These are created using data collected through remote sensing techniques or from land surveying.
Accuracy of DEM
The vertical accuracy of elevation data is the possible height difference between the modeled height and the actual height of the land.
Various methods of generating elevation data, like LiDAR and photogrammetry have different levels of accuracy. Among these, LiDAR is mostly the preferred source for elevation modeling because of its excellent horizontal resolution and vertical accuracy. Also, its the ability to omit features like buildings and vegetation, from the study area of any landscape.
Unfortunately, LiDAR is extremely high in price, therefore, is flown over small but high-value areas such as cities, along with using photogrammetry to collect large-scale data.
DEM- derived products quality:
Several factors play an important role in the quality of DEM-derived products:
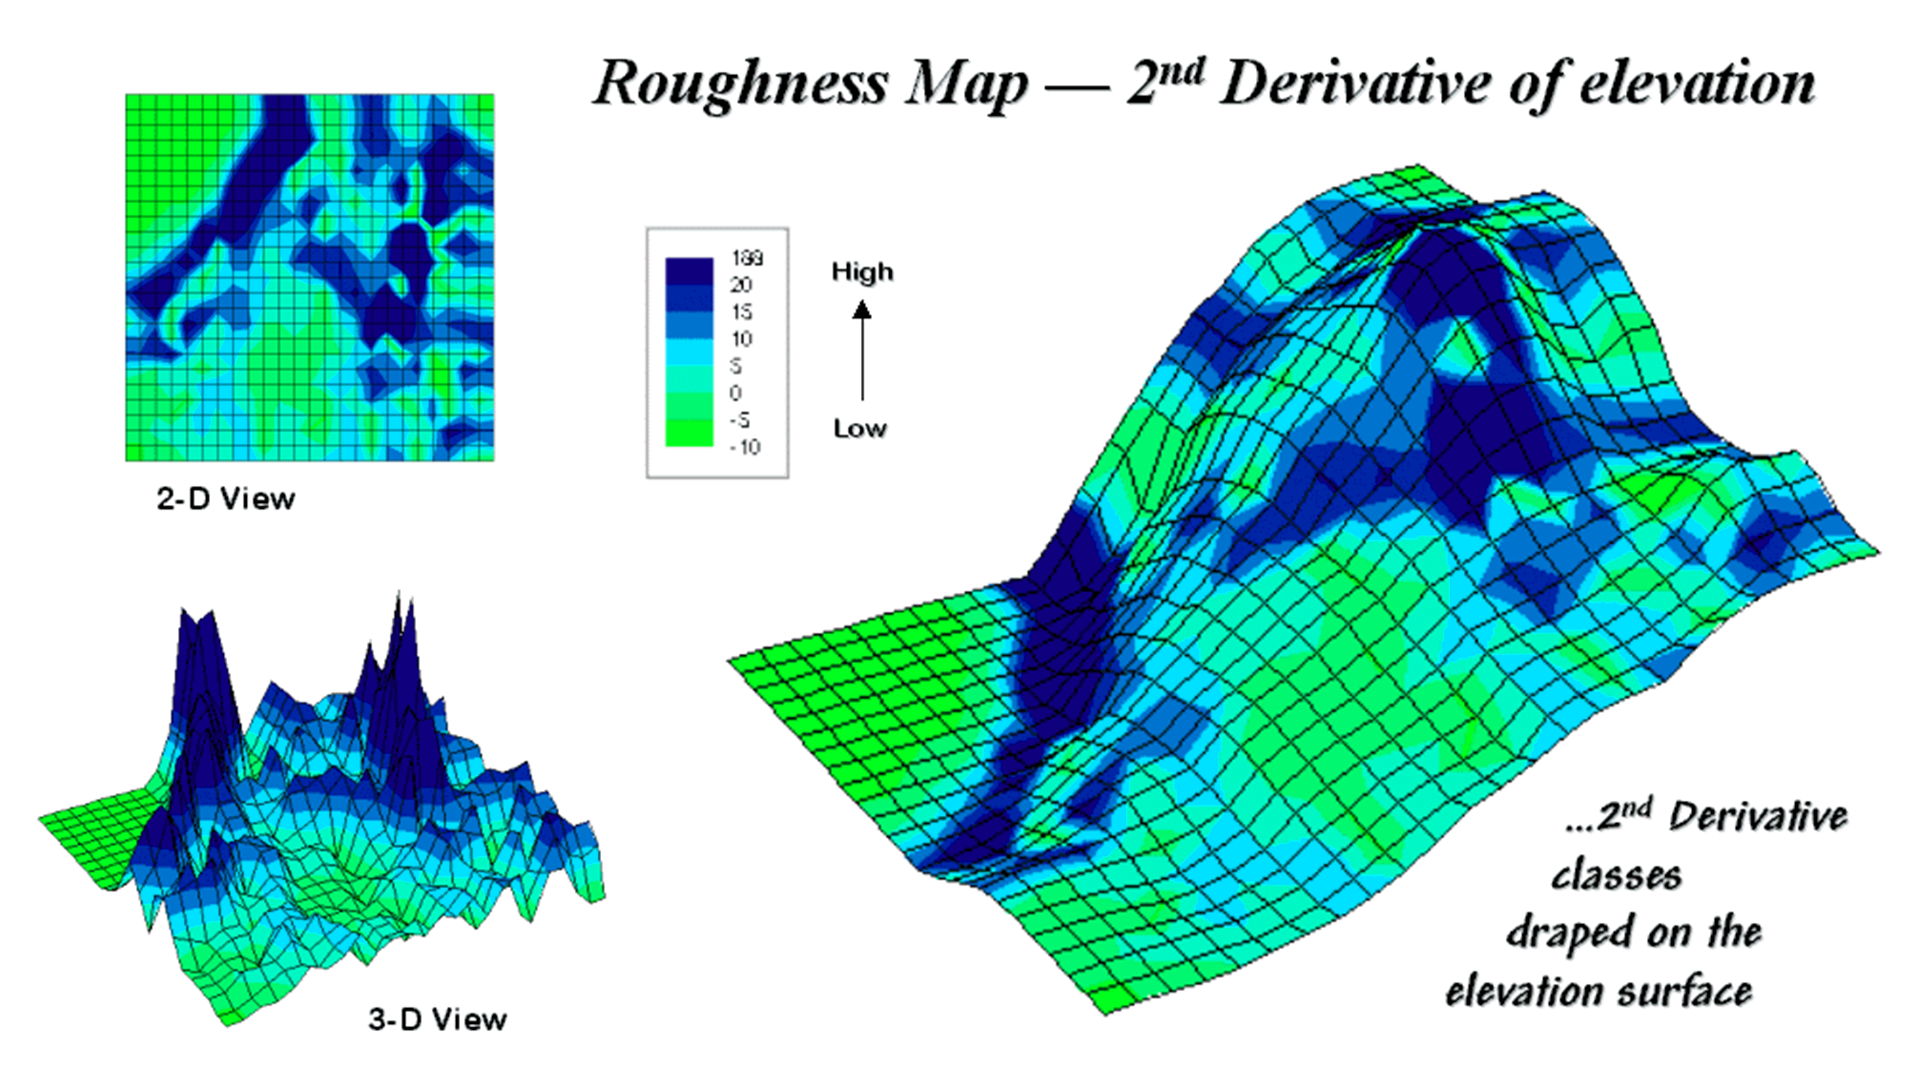
- Terrain roughness – Dem is used in the extraction of terrain parameters through the slope, root-mean-square height, and vector deviation.
- Sampling density (elevation data collection method)- sampling density is done with the help of a collection elevation point and with the help of various Remote Sensing techniques height point is generated.
- Grid resolution or pixel size-Ground resolution of the map explains a grid cell and the grid cell will depend upon the map of the scale. The spatial resolution of a 10 meter means one grid cell is represented by 10 * 10 areas of physical land.
- Interpolation algorithm – DEM adopted a data structure that stores topographic information and interpolation is used to establish the value for entire terrain points.
- Vertical resolution-Vertical resolution defines how accurately the elevation value that is stored in its pixel in the DEM matches the pixel with the elevation of the land surface.
- Terrain analysis algorithm-Terrain analysis is the interpretation of topographic features through GIS such features are slope, aspect, contour lines, and floor upslope lines.
- Reference 3D products include quality masks that give information on the coastline, lake, snow, clouds, correlation, etc.
DEM ERRORS
DEM errors occur in the horizontal as well as vertical directions. Errors originate from the input data used to create a DEM to calculate surface derivatives. The spatial variation of DEM error is commonly calculated by accuracy statistics of areas disaggregated by the slope.
In the case of the DEM matrix, errors are an attributive type, that is, they suggest an incorrect proportion of height and change the values of the Z-axis. These errors often occur in the DEM creation process, both through manual processes. It is, therefore, necessary to use systematic methods for their correction, evaluation, and adjustment.
Three types of Errors in DEM:-
- Gross Errors occur in DEM by the mapping process of the source data due to the missing surface caused by the inattention of the topographer and error in the interpolation process occurs due to the straight lineaments caused by poor control of the edge matching. The gross error occurs when the Over-generalization of relief is caused by unskilled topographers.
- Random Errors occur due to the wealth of measurement and operational tasks performed to create a DEM and remain even after known blunders and systematic errors are removed.
The common blunders or random errors originate from:
(a) a deficient sampling of spatial data and age of data
(b) processing errors like interpolation or numerical errors due to the undulation of a flat surface caused by an unstable interpolation algorithm
(c) measurement errors from positional inaccuracy, faulty equipment, or observer bias
- Systematic Errors occur in the DEM creation process by processing techniques that can cause bias or differences. Blunders originate from human error or equipment failure.
Correcting DEM error
There are three categories of steps to correct DEM errors:
- DEM editing- DEM errors can be reduced by editing, either manually or systematically. Manual editing requires changing pixel values by taking the help of additional information or expert judgment.
- New DEMs created with improved sensing technologies- Advances in satellite technology, image processing, and data storage capabilities, allow the creation of new and more accurate DEMs completely possible.
- Stochastic simulation of DEMs- DEMs are simulated by altering pixel values as per the spatial error structure. A single true DEM is not created. Instead, realizations provide abound within which the true value is likely to lie. Hence, DEM error is not reduced, but the bounds of error are identified.
USES OF DEM
Common uses of DEMs are:
- Obtaining terrain parameters for geomorphology
- Modeling water flow for hydrology or mass movement (for example avalanches and landslides)
- Modeling soils wetness with Cartographic Depth to Water Indexes (DTW-index)
- Creating relief maps
- Rendering of 3D visualizations.
- 3D flight planning and TERCOM
- Creating physical models (including raised-relief maps)
- Rectification of aerial photography or satellite imagery
- Reduction (terrain correction) of gravity measurements (gravimetry, physical geodesy)
- Terrain analysis in geomorphology and physical geography
- Geographic information systems (GIS)
- Engineering and infrastructure design
- Satellite navigation (for example GPS and GLONASS)


